It is an article about a simple, lightweight technique that makes the sizing process a little easier in the daily life of a Scrum team. Using story points may be challenging, but this tool makes it much easier. Originally published at Scrum Alliance on January 2013 (but because of multiple reorganizations of Scrum Alliance’s website, it is no longer there).
Caution: this is an article from 2013. Now I would add only this tip: use this technique by all means if you have to use story points…
“Scrum is easy, implementation is hard” – probably you’ve already heard that many times. The same goes for some particular tools like planning poker. The practice itself is very straightforward, however, how to use it productively over a longer period of time is harder.
In this article, I’ll share a simple lightweight technique that makes the sizing process a little easier in the daily life of a Scrum team.
Let’s return to the challenge.
As you know, story points are a relative measure of size. So there is no way to estimate one single story in story points, you are always comparing one story to other stories via story points. That often works well at the very beginning of your Scrum project, when a team estimates a lot of new stories during a short period of time.
But later, during regular re-estimations of existing stories or estimations of newly added stories it becomes much harder because the calibration of one story point got forgotten: “what is 1 story point?”, “is this story really three times bigger than our gold etalon – I’m not so sure…”, “These two stories of size 5 do not look similar to me…”. Known challenge..?
Suggested solution
There is a nice easy solution to this problem. I’m calling it the “estimation net”. The idea is very simple. Create a visual table, one row for each estimation size you are using. If you are using the Fibonacci sequence for estimations, you’ll have separate rows for “0.5”, “1”, “2”, “3”, “5” and “8”. And then for each size (each row), you put a few story cards as examples of that size. Here is an illustration of how it should look like:

Having such a net in front of your team during the sizing process makes it much easier because you have a few real examples within each size and can compare your new story to these examples.
How to fill such a net in the first place..? Start with something; it still would be much better than not having it at all. The general rule of thumb is: to add there only “typical” stories, so there is a chance that you would do something similar to this in the future.
The Estimations net tool is aimed to help you with future estimations! Therefore, if your specific story was unique and you are not likely to do anything close to that in the future – there is no place for such a story on this net.
More hints on how to build it
Another hint that solves a lot of difficulties some team members might have: it’s important to remember what some exact estimation value means..? Let’s say “5” – what is that? Let’s remind how we do the estimation. If a team believes the story size is bigger than “3” and less than “5” – it becomes “5”. So basically “5” means all stories within an interval from 3 to 5. Remembering that makes it much easier to put two fairly different stories (for example, one, let’s say, is just a little bigger than 3 and another one is just a little less than 5) in the same row as equal. I’m even putting those intervals close to the size value in the 1st column (as you might see from the pic above) – to visually remind you about that.
And then you are reviewing and improving this net over time (surprise-surprise 😉 During each sprint retrospective or once in a few iterations, you could go through your network to check if all present stories are still relevant and if it’s reasonable to put there some new stories that you’ve just worked over.
It works best if you have 2-5 stories as examples for each size (each row). You should have some minimum as a basis for comparison and you should not have too many stories because that would make the comparison process too complicated and long.
Here are a couple of examples of how this net might look in real life:
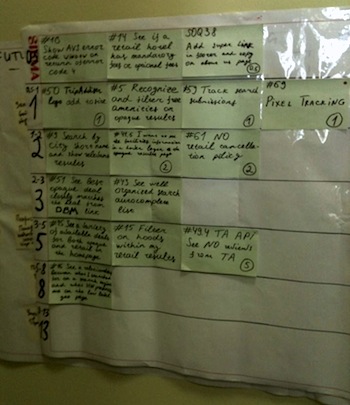
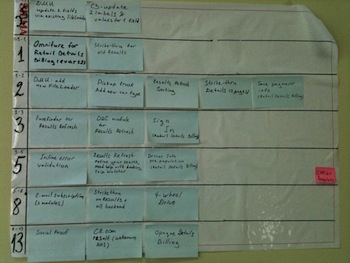
There is no reason to have your net for all possible size points (like 20, 40, or 100). You need to focus only on those sizes, which are relevant for stories small enough to come into iteration. That depends on your size selection. My suggestion for that is all sizes up to 8.
Again, this tool is very easy to introduce and use. From my experience it has an extremely low resistance level from teams, in other words, it is accepted very well, so try it out – you are not risking it. As for me, this is one of the easy process experiments to discuss with your team during the next retrospective and give it a try.
If you have any questions, feel absolutely free to contact me.